 The Runner Story

Introduction to Data-Driven Marathon Training
Intermediate runners preparing for marathons in 2026 increasingly rely on precise training metrics to move beyond generic plans and achieve personalized endurance gains. By tracking variables such as pace variability, running power, and heart rate dynamics, athletes can refine weekly loads, reduce injury risk, and improve race-day efficiency. This approach emphasizes evidence-based adjustments rather than intuition alone, allowing runners to build aerobic capacity systematically while monitoring recovery signals. Data-driven methods have gained traction because they provide objective feedback on training effectiveness, helping athletes avoid plateaus and overtraining syndromes common in high-mileage preparations.
Successful marathon preparation integrates real-time data from wearables with trend analysis to guide progressive overload. Runners who master these tools often see measurable improvements in aerobic capacity and pacing consistency. The 2026 racing calendar offers numerous opportunities for personal bests, but success hinges on interpreting metrics correctly rather than collecting them passively.
Essential Metrics for Endurance Building
Selecting the right metrics forms the foundation of data-driven training. Key indicators include pace variability, which measures fluctuations in speed across efforts, and running power, expressed in watts, that quantifies mechanical output independent of terrain or elevation changes. Pace variability below 4% during steady-state runs typically signals strong neuromuscular control and economical form.
Additional metrics worth monitoring are heart rate recovery, training stress score (TSS), and acute-to-chronic workload ratio (ACWR). Heart rate recovery after hard intervals can reveal cardiovascular fitness gains when it improves by 10-15 beats within the first minute. TSS quantifies training load by combining duration and intensity, while ACWR helps prevent spikes that lead to injury. These help athletes balance intensity with recovery to avoid overtraining.
- Pace variability: Lower values indicate smoother, more economical running; track it during tempo sessions to identify fatigue onset.
- Running power: Useful for hilly courses where pace alone misleads effort assessment; target consistent wattage ranges for race simulation.
- ACWR: Aim to keep ratios between 0.8 and 1.3 for sustainable progression; values above 1.5 warrant immediate load reduction.
- Heart rate recovery: Monitor drops of 20+ beats in 60 seconds as a positive adaptation sign.
Integrating Tools for Real-Time Analysis
Modern platforms allow seamless data capture during runs. Devices from Garmin, Coros, and Polar feed directly into apps that calculate advanced metrics automatically. Pairing a chest-strap heart rate monitor with a foot pod enhances accuracy for power and cadence tracking, often achieving sub-2% error margins compared to lab testing. Real-time analysis during workouts enables immediate form corrections, such as shortening stride when variability spikes.
Integration often involves syncing data to cloud dashboards for post-run review. Athletes benefit from setting alerts for threshold breaches, such as excessive pace variability exceeding 5% during long runs. Many runners export files to multiple platforms for cross-verification, ensuring no single device glitch skews interpretation. This layered approach supports nuanced adjustments throughout a 16- to 20-week build-up phase.
Interpreting Trends to Adjust Weekly Loads
Raw numbers gain value only through trend interpretation. Review seven- to fourteen-day rolling averages to detect patterns like rising TSS without corresponding fitness gains, signaling the need for a recovery week. Consistent upward trends in power at threshold pace indicate improving endurance, while sudden drops may reflect accumulated fatigue or nutritional shortfalls.
Step-by-step example: After a 20-mile long run showing 12% pace variability, reduce volume by 15% the following week while maintaining intensity. Reassess ACWR; if above 1.5, insert an easy day immediately. Another example involves comparing monthly averages: if TSS increases 8% but race pace equivalent stays flat, introduce hill repeats to boost power output without raising overall volume. These iterative reviews prevent stagnation and keep training stimulus optimal.
Comparing Popular Training Apps
Choosing the right platform depends on metric depth and user interface. Strava excels at social motivation and segment analysis, while TrainingPeaks offers detailed TSS modeling for structured plans. Garmin Connect provides robust power and variability charts at no extra cost for device owners. Each app has trade-offs: Strava emphasizes community segments that motivate tempo work, whereas TrainingPeaks delivers precise workout execution scoring and long-term planning calendars.
Intermediate runners often combine apps: use Strava for motivation and export data to TrainingPeaks for deeper modeling. This hybrid approach supports comprehensive 2026 race preparation without overwhelming the user. When evaluating options, consider data export flexibility and integration with lab-grade devices for the most reliable metric streams.
Actionable Adjustments Based on Data
When metrics indicate stagnation, implement targeted changes. For high pace variability, incorporate stride drills twice weekly to improve running economy. If power output drops mid-run, evaluate nutrition timing or shoe cushioning and consider a 10% intensity reduction for the next session. Sample adjustment protocol: Calculate weekly TSS target at 10% above prior month average, then monitor recovery metrics. Adjust sleep or cross-training if morning heart rate rises consistently by more than 5 beats per minute over three days.
Practical case: A runner tracking 2026 marathon prep noticed ACWR climbing to 1.6 after back-to-back long runs. The response was swapping one long effort for a recovery-focused easy day with cadence focus, restoring the ratio to 1.2 within seven days and preserving fitness momentum.
Sample Metric Dashboard for 2026 Prep
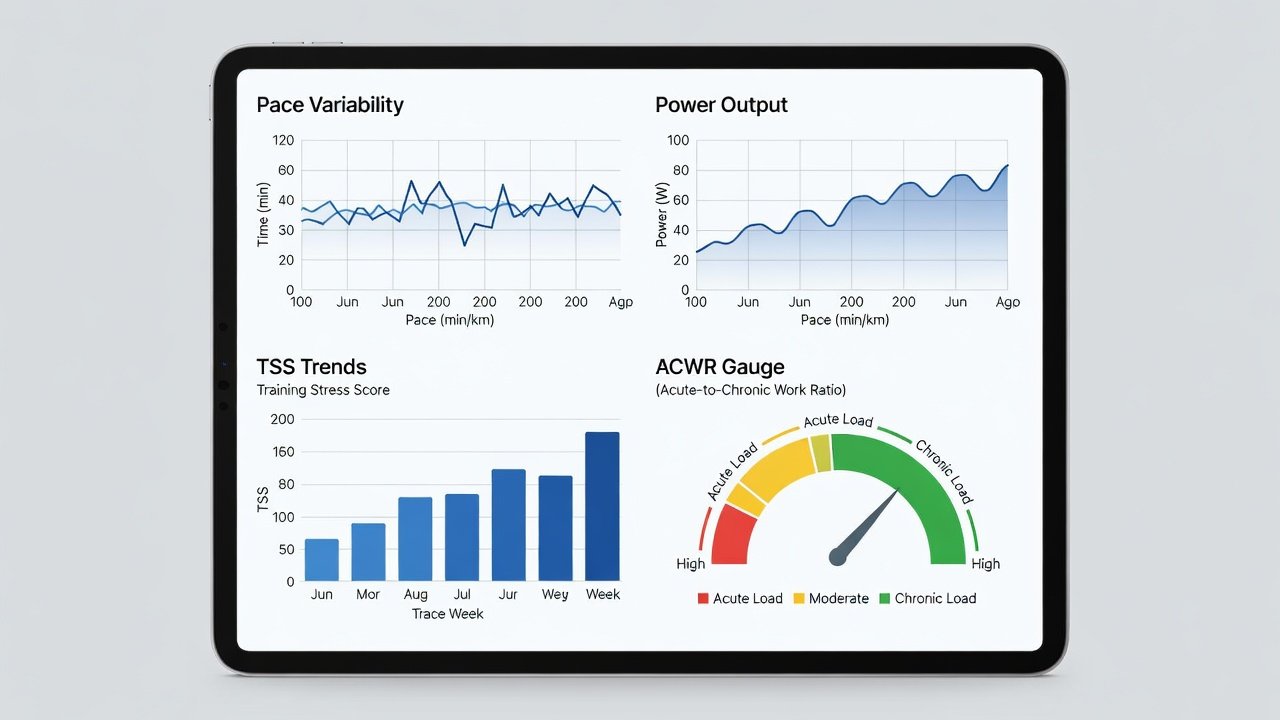
A typical dashboard displays:
- 7-day TSS trend line with goal overlay
- Pace variability histogram broken down by workout type
- Power-to-weight ratio over key workouts, updated weekly
- ACWR gauge with color-coded zones and historical comparison
- Heart rate recovery averages plotted against sleep duration
Review this dashboard every Sunday evening to plan the next microcycle. Customize alerts for any metric drifting outside personalized thresholds derived from the prior three months of data.
FAQs on Avoiding Analysis Paralysis
How many metrics should I track? Focus on three core metrics initially to prevent overload and gradually layer in others as familiarity grows.
What if data contradicts how I feel? Prioritize subjective recovery alongside numbers; use World Athletics guidelines for balanced programming that respects both objective and subjective inputs.
Can beginners apply these methods? Intermediate athletes benefit most; start with basic pace tracking before advancing to power metrics and full dashboards.
How often should I review full trends? Weekly reviews suffice for most; daily checks are reserved for high-stakes build phases within four weeks of race day.
Conclusion
Data-driven endurance training empowers marathoners to optimize every mile with precision. By mastering metrics like pace variability and power, integrating reliable tools, and interpreting trends thoughtfully, runners can build sustainable fitness for 2026 success. Regular dashboard reviews and measured adjustments turn raw data into personal bests while safeguarding long-term health. Consistent application of these principles separates good performances from breakthrough races, turning intermediate athletes into confident, data-informed competitors ready for any marathon challenge.

No comments yet. Be the first!